Compass Updates

Hand holding compass, Cypress Bank magazine cover
The Compass Q3 2025

Time to Hunker Down

One of the many lessons learned from living in Florida is that every year brings with it Hurricane Season. At the start of each season, weather experts run their models, weighing countless variables and historical patterns, to forecast how many storms may develop and how many might become hurricanes. Some years, the storms fizzle and we are spared the worst. Other years, their models prove prescient, and people in the path of nature’s wrath face devastating consequences.
The stock market often presents a similar dynamic. At the risk of sounding like “Chicken Little,” we see a set of conditions today that give us pause. These factors do not guarantee a storm is coming, but they do warrant greater vigilance. Specifically, three stand out:

i. Valuation

The S&P 500 is trading at a Cyclically Adjusted Price-to-Earnings (CAPE) ratio above 38 for three consecutive months. In the past century, this has only happened twice — in 1999 and late 2021. Historically, this ratio ranges between 15 and 22(1).

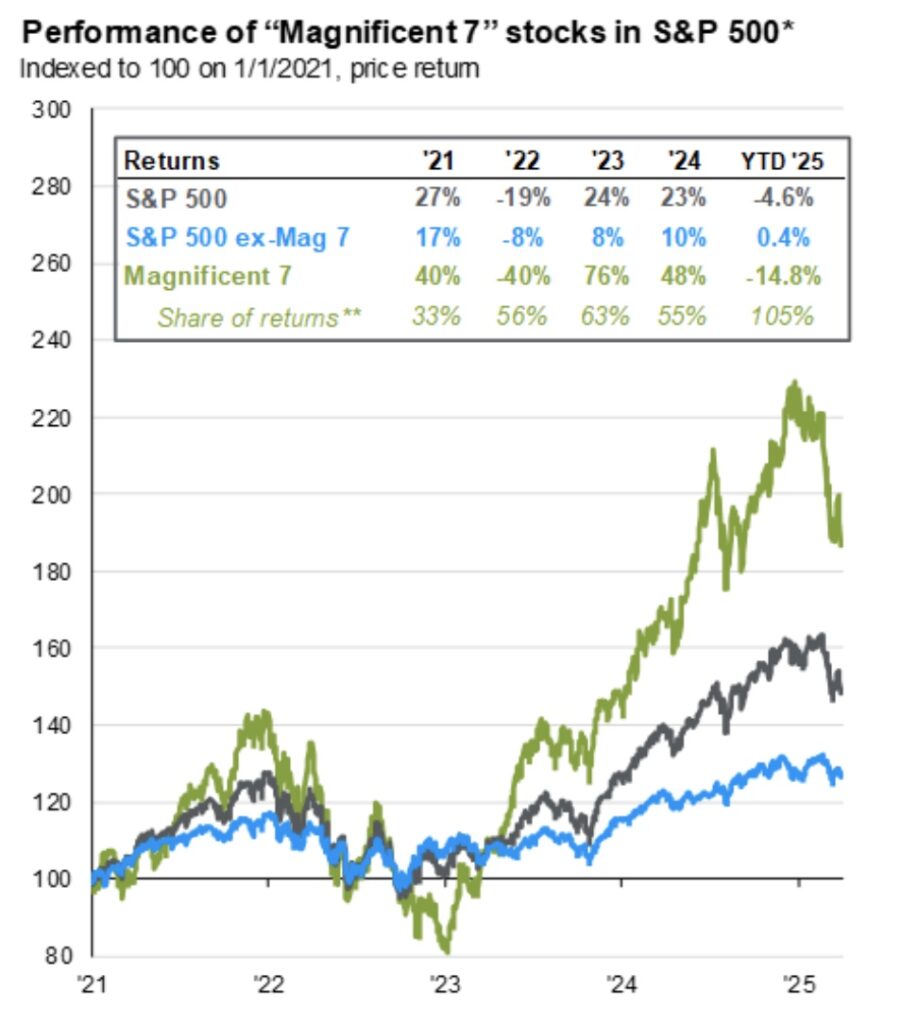
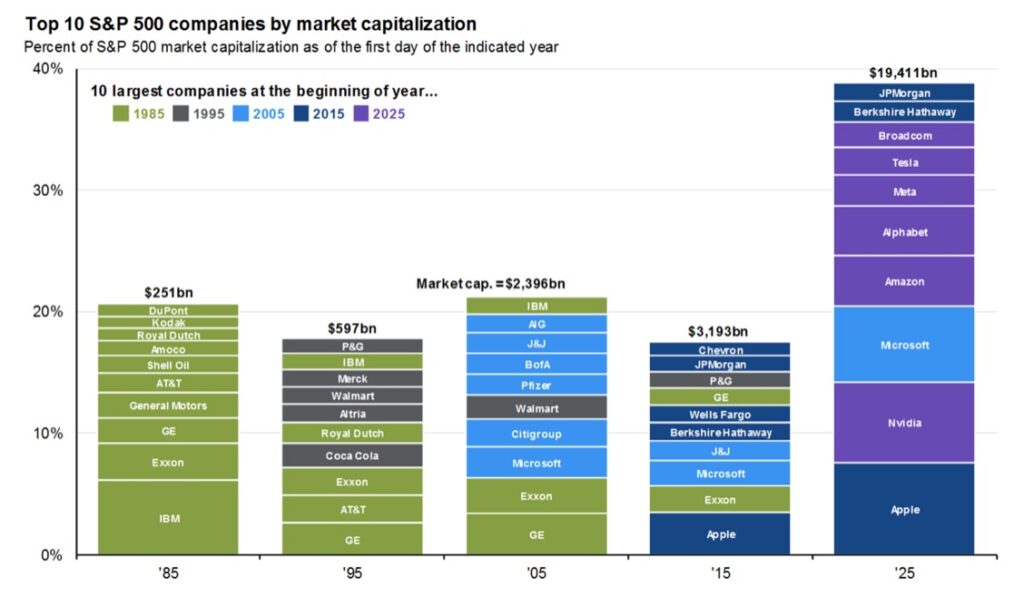
ii. Market Concentration

The top ten stocks now account for nearly 38% of the S&P 500, compared with a historical range of 20–25%. Earnings growth has also narrowed, with Information Technology and Communication Services responsible for 70% of S&P earnings growth since late 2022 and 90% over the past year (2).

iii. Leverage

Margin debt — credit extended against marketable securities — has surpassed $1 trillion. It has grown 33% in the past year, nearly twice the pace of the S&P 500 itself (3).

Like hurricane forecasts, these signals do not tell us precisely when or if a market storm will arrive. What they do suggest is that the conditions are in place. At Cypress Bank & Trust, our role is to prepare clients to withstand whatever comes.

Our investment philosophy is never to be “all in” or “all out.” Instead, we manage portfolios that balance risk and reward in the context of each client’s individual circumstances, income needs, and long-term goals. By budgeting for risk and structuring portfolios with resilience, we help clients weather the inevitable storms and continue on the path toward their objectives.

Top 10 S&P 500 companies by market capitalization over time.
Figure 1: JPMorgan Asset Management, Bloomberg, S&P.  Guide to the Markets – 09/30/2025

Equity Market

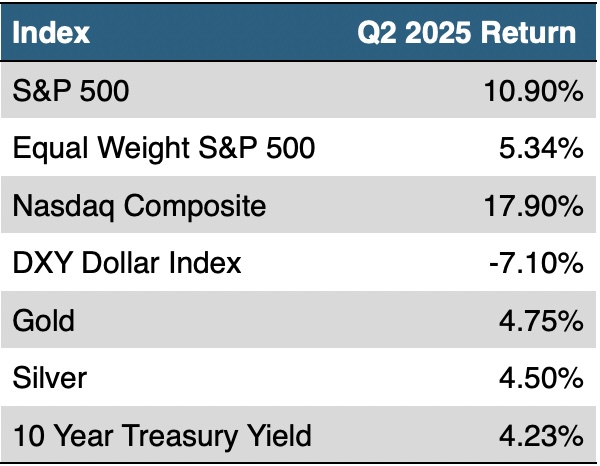
The U.S. equity market delivered robust gains in the third quarter, with all major indexes including the S&P 500, Nasdaq Composite, and Dow Jones Industrial Average reaching new record highs. This rally was fueled by several key factors: stronger-than-expected Q2 earnings, sustained momentum in artificial intelligence (AI) across semiconductors and the broader tech sector, growing expectations of Federal Reserve rate cuts later in the year, and a swift rebound from the tariff-driven selloff in April (4).

Technology led the third quarter sector performance with a 14% return, followed by Communications, which gained 12%. The continued acceleration of AI innovation and investment was a major catalyst, with mega-cap tech firms like Apple, Alphabet, and Nvidia driving much of the upside (5).

On the currency front, the U.S. Dollar Index (DXY) declined 9.5% year-to-date, reflecting broad weakness against major global currencies. This depreciation supported gains in hard assets, particularly precious metals. Silver stood out with a 28% surge, benefiting from both safe-haven demand and strong industrial usage. Gold also posted a solid 16% quarterly gain, climbing to a record high above $3,800 per ounce, as investors sought protection amid geopolitical tensions and concerns over elevated equity valuations (6).

Fixed Income

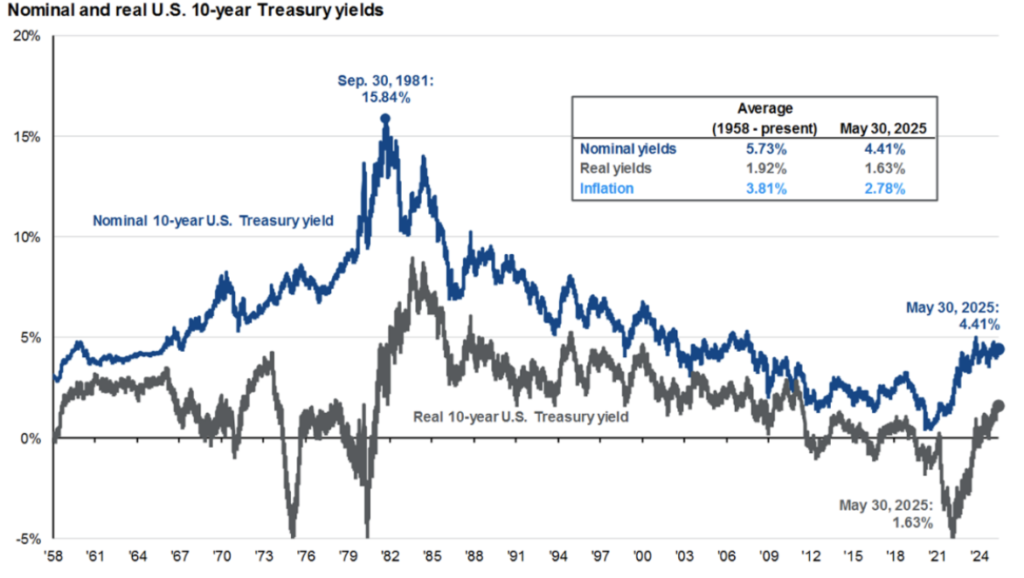
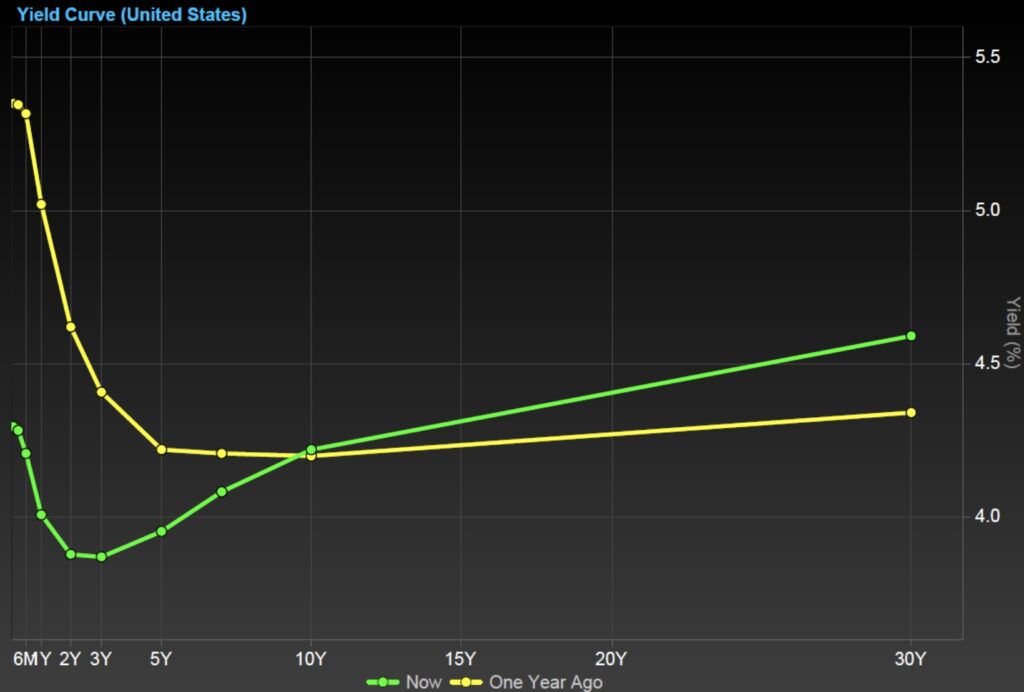
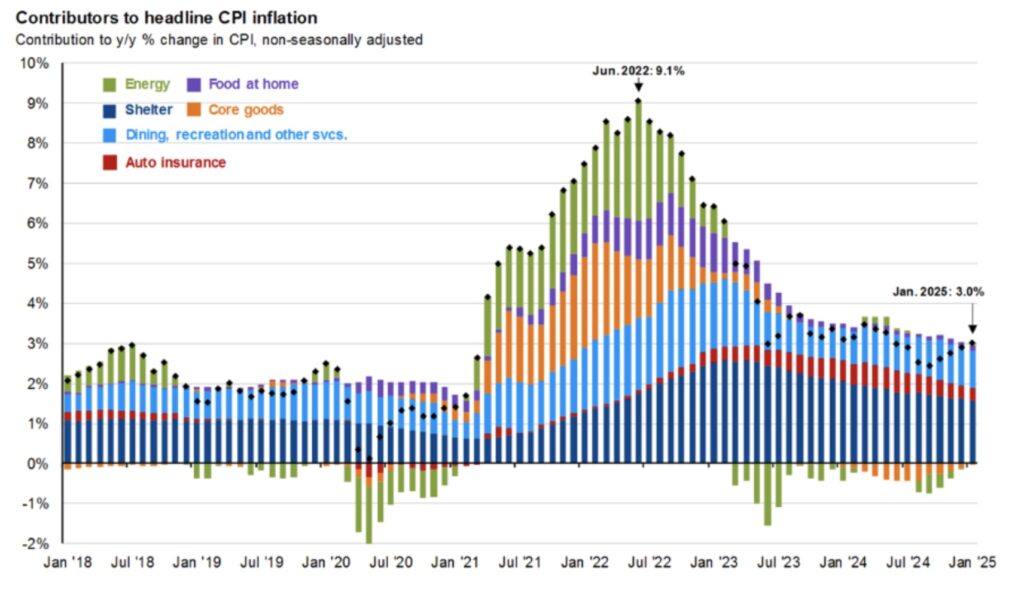
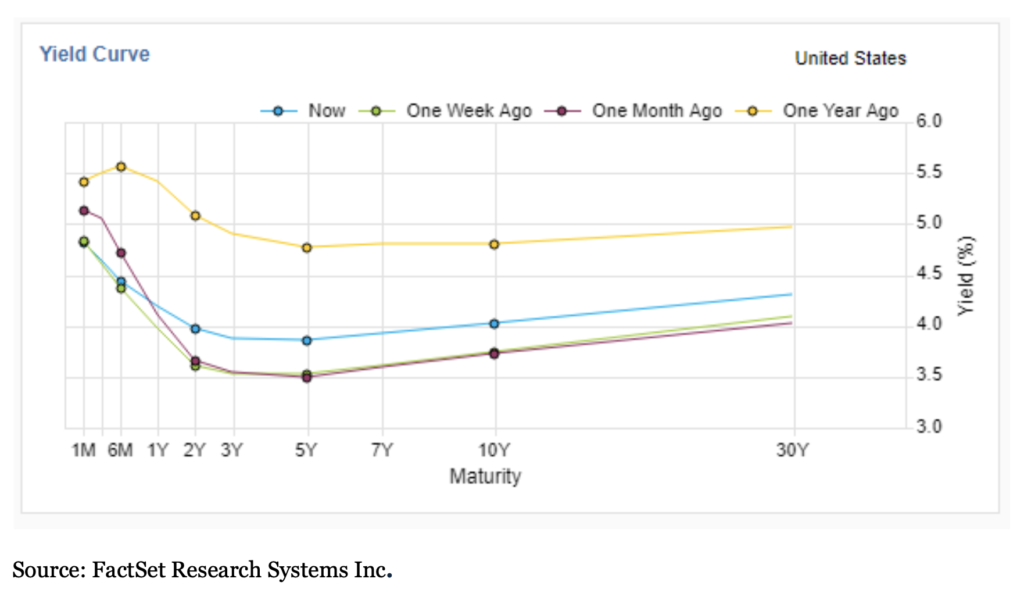
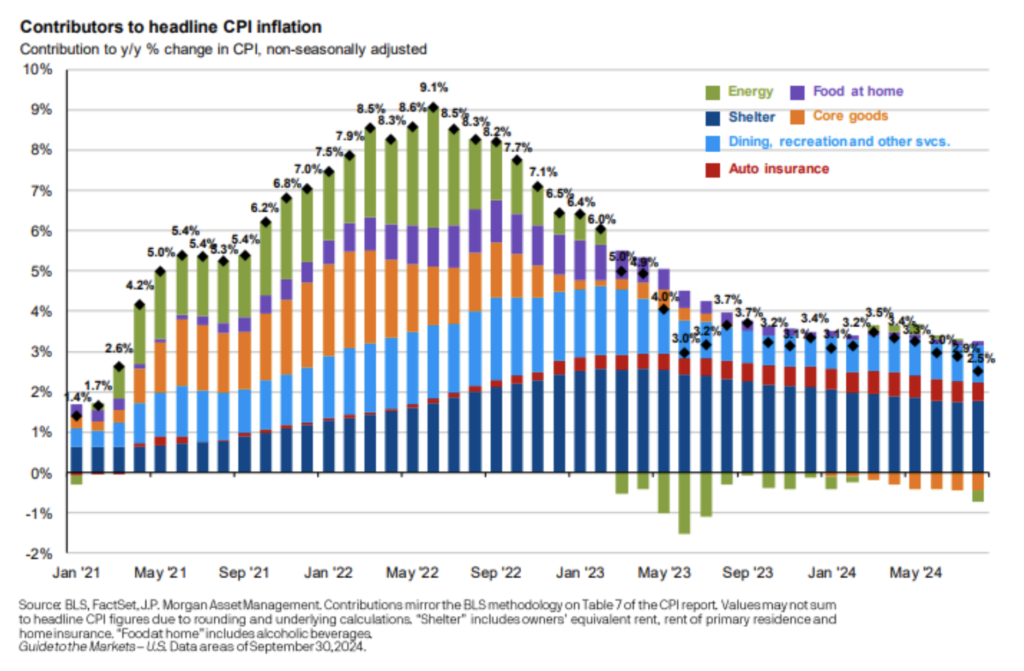
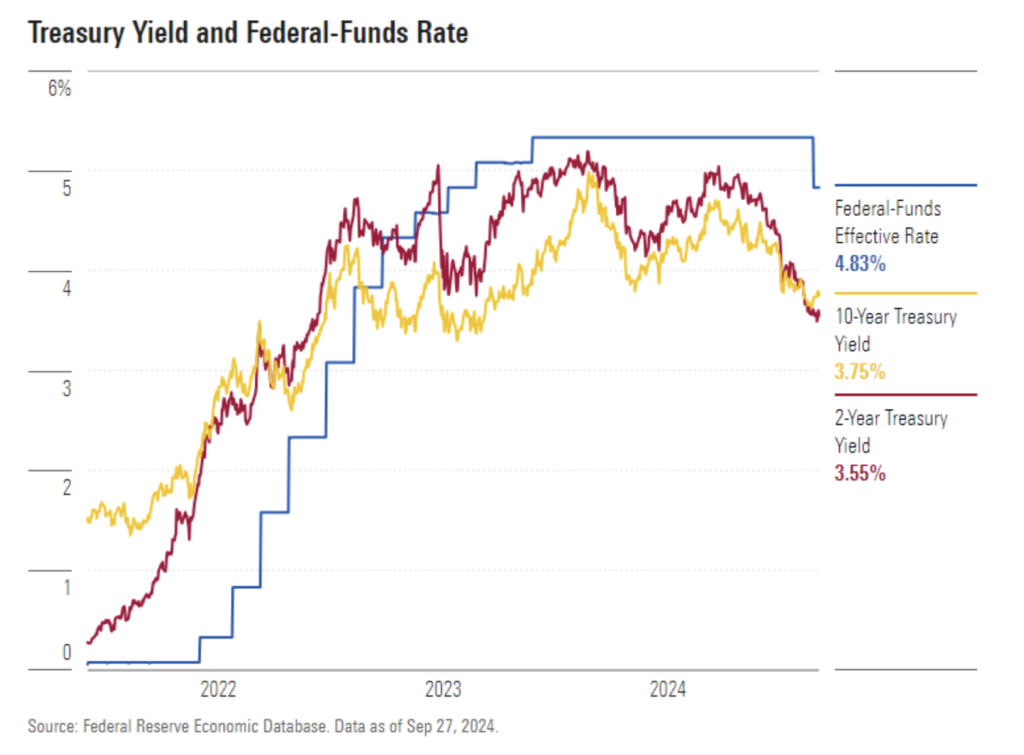
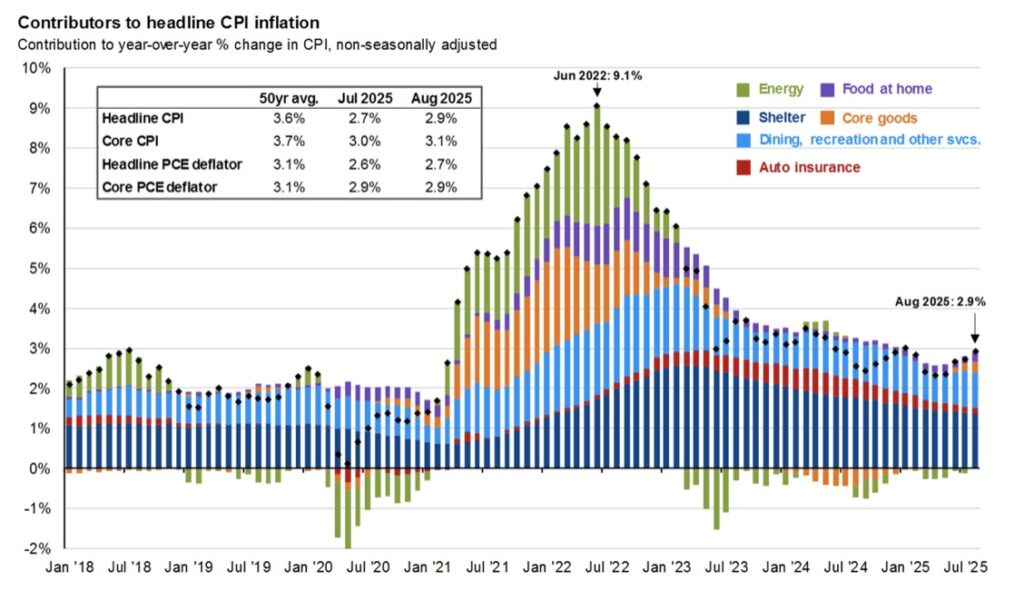
In a widely anticipated move, the Federal Reserve lowered its benchmark interest rate in September for the first time in a year, adjusting the target range to 4.00%–4.25%. This shift toward a more accommodative stance was driven by growing signs of labor market weakness, although inflation measures are proving sticky above the Federal Reserve 2% target. The rate cut provided a clear boost to fixed income markets, reinforcing expectations that the Fed will continue easing at a measured pace into 2026. Current projections by analysts and investors suggest the policy rate could settle between 3.0% and 3.5%, as officials weigh persistent inflation pressures against a softening employment backdrop (7).

Graph showing contributors to headline CPI inflation, 2018-2025.
Figure 2: JPMorgan Asset Management, Bloomberg, S&P.  Guide to the Markets – 09/30/2025

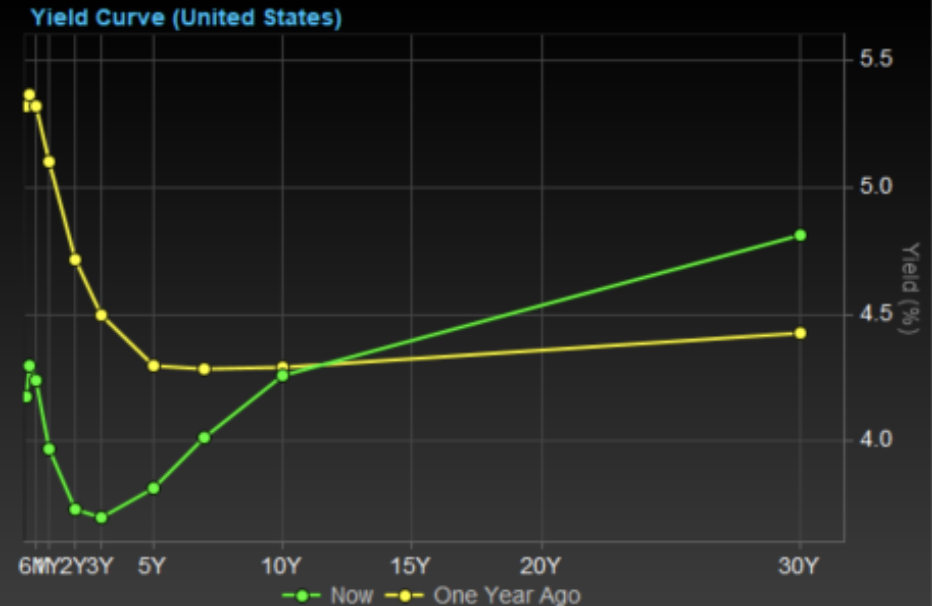
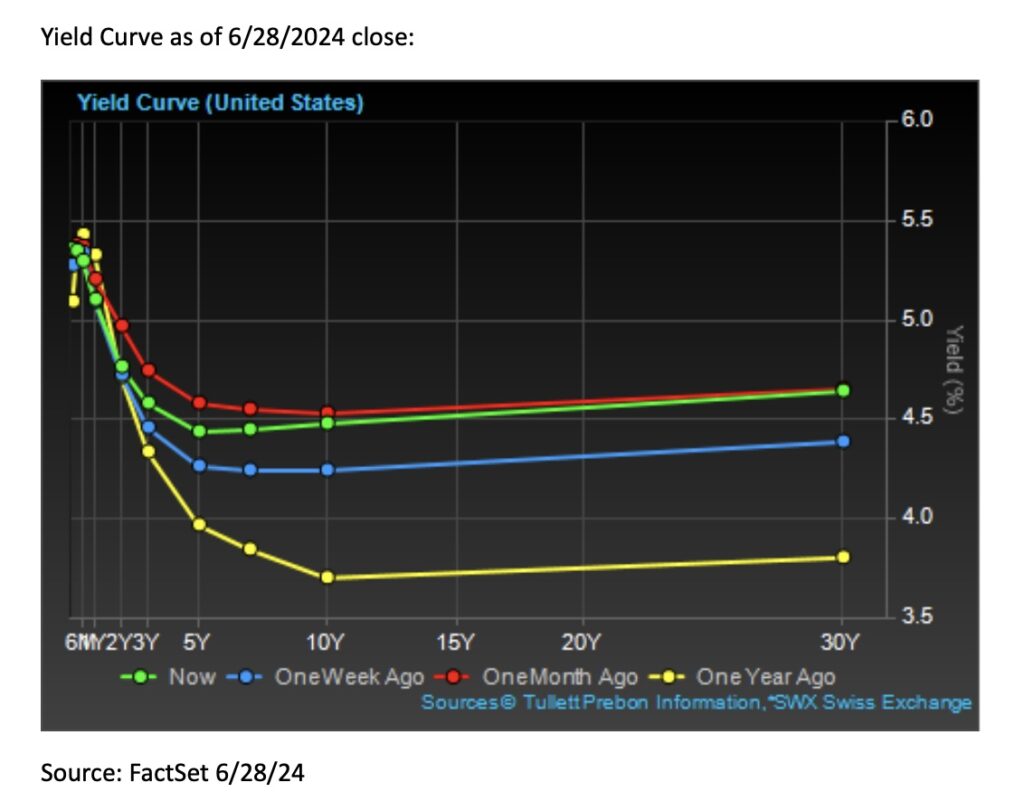
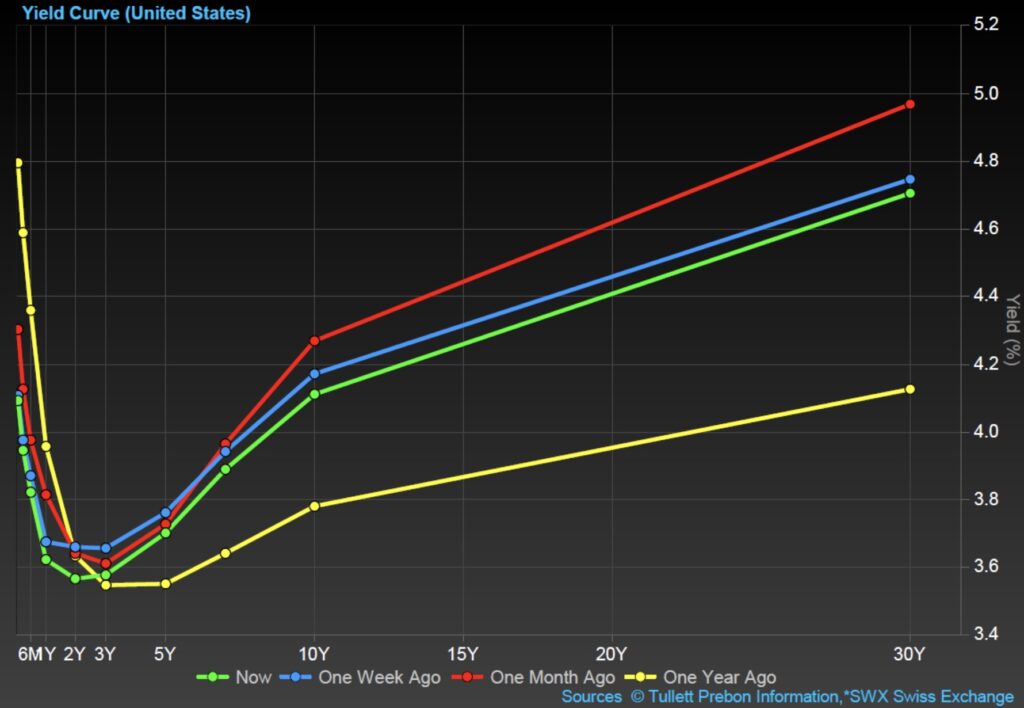
Treasury yields declined across the curve during Q3, contributing to a steepening yield curve. The 10-year Treasury yield ended the quarter near 4.10%, while the 2-year yield fell to 3.54%, reflecting expectations of further rate cuts. Meanwhile, the 30-year yield remained elevated for most of the third quarter, hovering around 5% before closing at 4.7%, driven by concerns over long-term fiscal sustainability and policy uncertainty (8).

US yield curve comparison chart
Figure 3:  FactSet Dashboard, Tuller Prebon Information, 10/01/2025.

Outlook: Q4 2025 and Beyond

As we enter the final quarter of 2025, financial markets are showing signs of cautious optimism. U.S. equities continue to perform well, particularly in the technology sector, driven by strong earnings and sustained investment in AI infrastructure. While inflation has moderated, global trade tensions and sector-specific headwinds—especially in manufacturing and diagnostics—are contributing to volatility. Ongoing monitoring of interest rate trends and geopolitical developments should dominate the headlines in the short term and be key drivers of the market’s direction.

Looking ahead to 2026, the outlook remains constructive. Analysts anticipate continued strength in U.S. equities, supported by easing monetary policy and robust consumer demand. The Federal Reserve is expected to maintain its rate-cutting trajectory, which could stimulate investment and support valuations across sectors. With the major markets near or at all-time highs, support from monetary and/or fiscal policy may not only be needed, but it may also already be priced in. However, risks such as persistent services inflation, wage pressures, and global policy uncertainty—particularly around U.S.-China trade relations—may impact margins and investor sentiment.

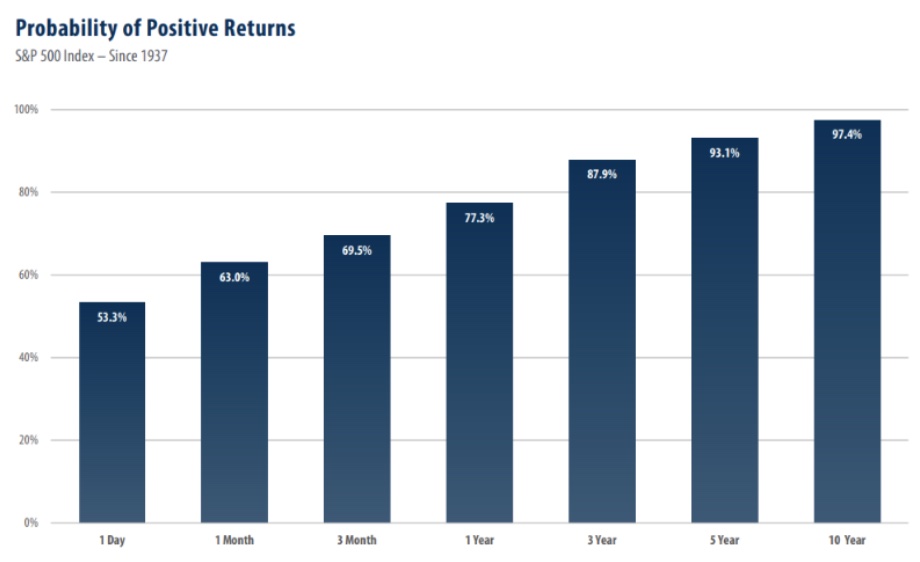
While short-term market fluctuations and macroeconomic uncertainties—such as inflation persistence and global trade tensions — may create volatility, we encourage clients to stay focused on their long-term financial goals. Diversification remains a key strategy for managing risk and smoothing returns across changing market conditions. By maintaining a disciplined approach and resisting the urge to react to short-term noise, investors can better position themselves to benefit from long-term growth opportunities. Our team is here to help you evaluate your portfolio, ensure alignment with your objectives, and make thoughtful adjustments as needed to navigate the road ahead with confidence.

Always vigilant, our commitment to you is to navigate your portfolio through both calm and turbulent times to meet your long-term goals and objectives.

Sources:

(1) Gurufocus.com; Ycharts.com. S&P 500 Shiller CAPE Ratio
(2) FactSet Earnings Insight 10/03/2025; FactSet Dashboard
(3) First Trust, Three on Thursday, 07/31/2025
(4) Yahoo.com, Dow, S&P 500, Nasdaq notch records on AI buzz even as government shutdown drags on, 10/02/2025
(5) Fidelity.com, Sector Returns, 10/01/2025
(6) FactSet Dashboard, 10/01/2025
(7) CME Group, CME FedWatch Tool, 10/01/2025
(8) CNBC.com, https://www.cnbc.com/bonds/


Disclosures

Trust and Portfolio Management services offered by Cypress Bank & Trust are not insured by the FDIC; are not deposits, are not guaranteed; and are subject to investment risks, including possible loss. This does not constitute an offer or solicitation. 

This information should not be considered investment advice. Opinions expressed reflect the judgment of the authors and are current opinions as of the date appearing in this material only. While every effort has been made to verify the information contained herein, we make no representations as to its accuracy and it should not be regarded as a complete analysis of the subjects discussed. Past performance does not predict future results. Content should not be construed as legal or tax advice. Always consult an attorney or tax professional regarding your specific legal or tax situation. All investing involves risk, including the loss of some or all of your investment. 

Any indices and other financial benchmarks shown are provided for illustrative purposes only, are unmanaged, reflect reinvestment of income and dividends and do not reflect the impact of advisory fees. Investors cannot invest directly in an index. Comparisons to indexes have limitations because indexes have volatility and other material characteristics that may differ from a particular fund. 

Certain information contained herein constitutes “forward-looking statements,” which can be identified by the use of forward-looking terminology such as “may,” “will,” “should,” “expect,” “anticipate,” “project,” “estimate,” “intend,” “continue,” or “believe,” or the negatives thereof or other variations thereon or comparable terminology. Due to various risks and uncertainties, actual events, results or actual performance may differ materially from those reflected or contemplated in such forward-looking statements. Nothing contained herein may be relied upon as a guarantee, promise, assurance or a representation as to the future. 

Information obtained from third party sources is believed to be reliable but has not been independently verified and its accuracy or completeness cannot be guaranteed. No representation is made with respect to the accuracy, completeness, or timeliness of this document. 

Specific investments described herein do not represent all investment decisions made by Cypress Bank & Trust. The reader should not assume that investment decisions identified and discussed were or will be profitable. Specific investment advice references provided herein are for illustrative purposes only and are not necessarily representative of investments that will be made in the future. 

Compass in hand, Cypress Bank quarterly publication
The Compass Q2 2025

“Investing is easier than you think, but harder than it looks.”
– Warren Buffett

At this year’s Berkshire Hathaway annual meeting, Warren Buffett announced that he will retire at the end of 2025—marking the close of what is likely the most extraordinary investing career any of us will witness. Over the years, Buffett has shared countless insights and principles, but few are as timeless as the one above.

In this quote, Buffett reminds us that the foundations of sound investing—diversification, patience, and long-term thinking—are not complicated. Yet, what makes investing difficult is managing our own behavior. Emotions like fear, greed, and impatience can quickly derail even the most straightforward strategy.

An important corollary to this idea is Amara’s Law, which states: “We tend to overestimate the effect of a technology in the short run and underestimate the effect in the long run.” We’ve seen this play out time and again—whether with electric vehicles, the internet, or artificial intelligence. Innovations often go through a predictable cycle: the initial burst of enthusiasm, followed by a period of disillusionment, and eventually, a more measured and transformative impact.

For investors, the challenge is recognizing where we are in this cycle—without the benefit of hindsight.

At Cypress Bank & Trust, we aim to address this challenge by constructing and managing client portfolios using time-tested principles. Our disciplined approach emphasizes diversification, patience, and a deep understanding of each client’s goals and circumstances. We don’t chase trends or react to headlines. Instead, we strive to deliver lasting value through thoughtful, long-term strategies.

By staying committed to these principles, we seek to help our clients navigate market turbulence with confidence—always with an eye toward the future they have told us what matters most.

Q2 2025 index returns: S&P 500, Nasdaq, Gold.
Source: FactSet. Data as of 06/30/2025.

Equities

The second quarter of 2025 was marked by heightened volatility in the equity markets, not seen since the second half of 2022. It tested investor conviction but also served to make way for good long-term opportunities. Fueled by the uncertainties imposed by the Tariffs, the S&P 500 hit correction territory and closed at its lowest level this year on April 8th, down 18.9% from its all-time high. By the end of June, the index clawed its way back and reached a new all-time high [1], driven by a potential ceasefire between Israel and Iran, and a looming trade deal with China and other nations. Despite a steep drawdown in early April, the Technology sector finished the second quarter as the best performing sector, returning 23.54%[2]. The Magnificent 7 stocks have returned 18.6% through the second quarter of 2025 outpacing the other 493 companies in the S&P 500 index by nearly 14 percentage points[3].

The Federal Reserve held rates steady in their two meetings this quarter, signaling that interest rate cuts may occur in 2025 if inflation eases and the labor market softens. As much as we have seen the Consumer Price Index easing since the beginning of the year from 3% in January to as low as 2.3% in April’s reading, in the most recent release from the Personal Consumption Expenditure it indicated that inflation has started to creep up as of June[4].

Graph of U.S. 10-year Treasury yields, 1958-2025.
Source: BLS, FactSet, Federal Reserve, J.P. Morgan Asset Management. Data as of 05/30/2025.

Fixed Income

The second quarter saw a high degree of yield swings in the U.S. fixed income markets, as investors had to navigate a terrain marked by rising yields, fiscal concerns, and shifting forecasts around the Federal Reserve’s interest rate policy. Longer maturity U.S. Treasuries sold off, pushing the twenty- and thirty-year yields above 5.1%, levels not seen in years, amid growing concerns over ballooning federal debt and the fiscal budget. As a consequence, long-term Treasuries returned -2.82% during the second quarter as measured by the iShares Twenty-Year Treasury ETF, ticker TLT [5].

US yield curve comparison over two years

Source: FactSet, Tullet Prebon Information. Data as of 06/30/2025.

While the Federal Reserve held rates steady in the second quarter, signaling a cautious path forward, investors began expecting interest rate cuts by September, contingent on how inflation and labor market data evolves until then. This resulted in a bond market that felt like anything but a safe haven with higher-than-normal volatility. 

Outlook

As we enter the second half of 2025, the financial markets continue to navigate a landscape shaped by cooling inflation, stable economic growth, and the Federal Reserve’s anticipated policy shift. With inflation steadily trending lower, the Fed is widely expected to implement one or two interest rate cuts before year-end. This easing cycle, coupled with resilient consumer and business activity, provides a constructive backdrop for both stock and bond markets—though geopolitical risks and the execution and implementation of tariff policy will add near-term volatility.

Equity markets have been largely supported by strong earnings and investor optimism, particularly in the technology sector. Looking ahead, we expect market leadership to broaden. Companies with healthy balance sheets, strong cash flow, and the ability to adapt to shifting conditions will continue to stand out.

In the fixed income space, higher yields are offering more compelling opportunities than we’ve seen in recent years. Investors are finding value across high-quality bonds, including Treasuries, municipals, and investment-grade corporates. Overall, staying diversified, maintaining a long-term perspective, and focusing on quality will be key strategies for navigating the months ahead.

Always vigilant, our commitment to you is to navigate your portfolio through both calm and turbulent times to work towards your long-term goals and objectives.

Footnote 1: Reuters.com, S&P 500, Nasdaq close at record highs. Published on 06/30/2025.
Footnote 2: Fidelity Sector Returns, data as of 07/01/2025.
Footnote 3: J.P. Morgan Asset Management, Review of markets over Q2 of 2025.
Footnote 4: U.S. Bureau of Labor Statistics, data as of 06/30/2025.
Footnote 5: FactSet Research Systems, data as of 07/01/2025.

Disclosures

Trust and Portfolio Management services offered by Cypress Bank & Trust are not insured by the FDIC; are not deposits, are not guaranteed; and are subject to investment risks, including possible loss. This does not constitute an offer or solicitation.

This information should not be considered investment advice. Opinions expressed reflect the judgment of the authors and are current opinions as of the date appearing in this material only. While every effort has been made to verify the information contained herein, we make no representations as to its accuracy and it should not be regarded as a complete analysis of the subjects discussed. Past performance does not predict future results. Content should not be construed as legal or tax advice. Always consult an attorney or tax professional regarding your specific legal or tax situation. All investing involves risk, including the loss of some or all of your investment.

Any indices and other financial benchmarks shown are provided for illustrative purposes only, are unmanaged, reflect reinvestment of income and dividends and do not reflect the impact of advisory fees. Investors cannot invest directly in an index. Comparisons to indexes have limitations because indexes have volatility and other material characteristics that may differ from a particular fund. 

Certain information contained herein constitutes “forward-looking statements,” which can be identified by the use of forward-looking terminology such as “may,” “will,” “should,” “expect,” “anticipate,” “project,” “estimate,” “intend,” “continue,” or “believe,” or the negatives thereof or other variations thereon or comparable terminology. Due to various risks and uncertainties, actual events, results or actual performance may differ materially from those reflected or contemplated in such forward-looking statements. Nothing contained herein may be relied upon as a guarantee, promise, assurance or a representation as to the future. 

Information obtained from third party sources is believed to be reliable but has not been independently verified and its accuracy or completeness cannot be guaranteed. No representation is made with respect to the accuracy, completeness, or timeliness of this document. 

Specific investments described herein do not represent all investment decisions made by Cypress Bank & Trust. The reader should not assume that investment decisions identified and discussed were or will be profitable. Specific investment advice references provided herein are for illustrative purposes only and are not necessarily representative of investments that will be made in the future. 

Compass in hand, Cypress Bank publication April 2025.
The Compass Q1 2025

“How puzzling all these changes are! I’m never sure what I’m going to be, from one minute to another.”
Alice from Alice in Wonderland by Lewis Carroll


So far 2025 seems to be a page taken out of Lewis Carroll’s classic Alice in Wonderland. Although we haven’t yet seen the Red Queen or the Mad Hatter the way the year is shaping up, we cannot entirely rule out those possibilities. We have seen a market correction, as defined by a decline in the stock market index from peak to trough of at least 10%, full blown rallies in stock prices that have seen the markets add near 3% to their value in a matter of days, and a constant flow of announcements coming out that drive investor sentiment swinging wildly between despair and euphoria.

Despite the volatility, our approach at Cypress has remained grounded in a steady, long-term view. We continue to focus on diversification and strategic asset allocation to potentially minimize risk while seizing potential opportunities in the market. While the S&P 500 in the first quarter of 2025 ended down 4.59%[1], other segments of the market demonstrated resilience in the face of turbulence and turned positive returns. It is a reminder that while the markets may be unpredictable in the short term, patience and disciplined investment strategies may still yield positive results over time.

As we navigate through these unpredictable times, we want to reassure you that we are closely monitoring the developments in the financial markets, adjusting portfolios where necessary, and continuing to work on your behalf to secure your long-term financial goals. We understand that the market’s emotional rollercoaster can create anxiety, but we are here to help you stay the course, making decisions that aim to align with your objectives, not the day-to-day fluctuations.

S&P 500 positive return probabilities by duration.
Figure 1: Source – First Trust, Bloomberg. Data from 12/31/1996 – 12/31/2024.

Equities

The first quarter of 2025 the S&P 500 Index was down 4.6% following a stellar 2024 that saw the index return over 23%. S&P 500 earnings in the fourth quarter of 2024 grew by 17.1%, with 74% of the companies surprising on the upside and 19% on the downside. Revenue growth for the index was not as strong but still managed to grow 5.1% in the fourth quarter[2]. The Information Technology sector, representing over 30% of the S&P 500, had a drawdown of –11.2%[3] since the beginning of 2025. We have also seen the Magnificent Seven stocks significantly underperforming the other 493 stocks in the S&P 500 in the first quarter, -14.8% vs. 0.4%[4], respectively.

The volatility in this quarter began late January when a Chinese Artificial Intelligence company called “DeepSeek” released its newly developed AI model reporting to have needed a much smaller investment than some of the large U.S hyperscale companies. Adding to the mix is the high valuation that the technology sector had, starting the year with a Price to Earnings ratio of 32.4, and if any news comes out that does not rhyme with perfection it would have and will cause volatility in this sector. On the flip side, the energy sector has enjoyed the best returns since the start of this year, gaining 10%[5], despite the price of oil decreasing in this period. As some of those companies with high valuations face uncertainty, investors are rotating to companies with lower valuations than the S&P 500 such as the ones in the Energy sector, its current price to earnings ratio is 15.7 vs. 20.9[6] of the broader market which would explain the outperformance we have seen thus far in the Energy sector. However, the year is not over yet and there are still many questions and uncertainties the market is waiting on for resolution.

Graph of Magnificent 7 stocks in S&P 500
Figure 2: Source – J.P. Morgan Asset Management, FactSet, Standard & Poor’s. Data as of 03/31/2025.

Fixed Income

The market is predicting, with a 90% probability, that the Federal Reserve will cut their policy rate by fifty basis points or more by the end of 2025[7]. The Federal Reserve has a dual mandate to maintain price stability and promote maximum employment with the use of monetary policy. As it stands inflation is far from its target and employment, although not at maximum, has shown itself to be stable. Inflation eased a bit over the last twelve months; however, it is proving to be sticky above the Federal Reserve’s 2% target. The Consumer Price Index increased 2.8% year over year in its latest reading at the end of February, within it the shelter index continues to account for most of the level of inflation as seen in figure 3. The unemployment rate has been mostly flat at 4.1% since June of last year[8], however U.S employers announced over 172,000 jobs cuts in February marking the highest monthly total since July 2020[9].

U.S. Treasury yields for mid to long term have decreased since the beginning of the year. The 2-year and 10-year rates both came down nearly forty basis points to 3.9% and 4.2%, respectively[10].

U.S. yield curve comparison chart, current vs. past year.
Figure 3: Sources – FactSet, Tullett Prebon Information.
Bar chart of CPI inflation contributors, 2018-2025.
Figure 4: Source – BLS, FactSet, J.P. Morgan Asset Management: Guide to the Markets. Data are as of March 31, 2025.

Outlook

The financial markets have experienced notable volatility in recent months, driven by a mix of economic data, central bank policies, and global geopolitical events. The equity markets started off the year as the previous two have finished but have reversed direction as they adjust to the issues addressed above and various levels of uncertainty have been introduced. Bond markets continue to adjust to shifting interest rate expectations, with yields fluctuating as investors assess the policy direction of central banks, both domestically and globally. Commodities, such as oil and gold have seen price swings due to supply chain disruptions and safe-haven demand.

Looking ahead, market sentiment will largely be shaped by monetary policy decisions and economic indicators, particularly inflation and employment data. The Federal Reserve and other central banks are expected to carefully balance growth and inflation concerns, with many investors anticipating potential rate cuts later in the year if inflation eases and/or the economy shows weakness. However, uncertainties remain, including geopolitical tensions, evolving trade policies, and risks of economic slowdown both in the U.S. and internationally.

As potential headwinds and further volatility are expected, the financial markets and investors will most likely focus on inflation trends, employment data, and corporate earnings to gauge the market direction, in the short-term and the remainder of the year.

Always vigilant, our commitment to you is to navigate your portfolio through both calm and turbulent times to work towards your long-term goals and objectives.

Footnote 1, 6: FactSet, data as of 04/02/2025.
Footnote 2: London Stock Exchange – S&P 500 Earnings Scorecard, data as of 03/21/2025
Footnote 3, 5: Fidelity, data as of 04/02/2025.
Footnote 4: JP Morgan Asset Management, FactSet, Standard & Poor’s, data as of 03/31/2025.
Footnote 7: CME Group – FedWatch Tool, data as of 04/02/2025.
Footnote 8: US Bureau of Labor Statistics, data as of 03/31/2025.
Footnote 9: Challenger, Gray, & Christmas Inc. 
Footnote 10: CNBC.com, data as of 04/02/2025.

Disclosures

Trust and Portfolio Management services offered by Cypress Bank & Trust are not insured by the FDIC; are not deposits, are not guaranteed; and are subject to investment risks, including possible loss. This does not constitute an offer or solicitation. 

This information should not be considered investment advice. Opinions expressed reflect the judgment of the authors and are current opinions as of the date appearing in this material only. While every effort has been made to verify the information contained herein, we make no representations as to its accuracy and it should not be regarded as a complete analysis of the subjects discussed. Past performance does not predict future results. Content should not be construed as legal or tax advice. Always consult an attorney or tax professional regarding your specific legal or tax situation. All investing involves risk, including the loss of some or all of your investment. 

Any indices and other financial benchmarks shown are provided for illustrative purposes only, are unmanaged, reflect reinvestment of income and dividends and do not reflect the impact of advisory fees. Investors cannot invest directly in an index. Comparisons to indexes have limitations because indexes have volatility and other material characteristics that may differ from a particular fund. 

Certain information contained herein constitutes “forward-looking statements,” which can be identified by the use of forward-looking terminology such as “may,” “will,” “should,” “expect,” “anticipate,” “project,” “estimate,” “intend,” “continue,” or “believe,” or the negatives thereof or other variations thereon or comparable terminology. Due to various risks and uncertainties, actual events, results or actual performance may differ materially from those reflected or contemplated in such forward-looking statements. Nothing contained herein may be relied upon as a guarantee, promise, assurance or a representation as to the future. 

Information obtained from third party sources is believed to be reliable but has not been independently verified and its accuracy or completeness cannot be guaranteed. No representation is made with respect to the accuracy, completeness, or timeliness of this document. 

Specific investments described herein do not represent all investment decisions made by Cypress Bank & Trust. The reader should not assume that investment decisions identified and discussed were or will be profitable. Specific investment advice references provided herein are for illustrative purposes only and are not necessarily representative of investments that will be made in the future. 

Compass on hand with Cypress Bank publication details
The Compass Q4 2024

“History doesn’t repeat itself, but it often rhymes”
-Mark Twain

2024 was another banner year for the stock market. In a year that started with a 7.6 magnitude earthquake hitting Japan and included continued armed conflict in Europe, a collapse of a major bridge in Baltimore, the conviction of Crypto King Sam Bankman-Fried, devastating hurricanes, Iranian missile strikes on Israel along with a small event called a presidential election the markets hit new highs over 55 times in 2024 in spite of all the disruptive events that took place.

As a result of the 23.3% gain in 2024 and the 24.23% return in 2023 the S&P 500 had the first 20% annual returns back-to-back since the late 1990’s [1]. Much of the gain in the S&P 500 can be attributed to a handful of stocks many of which were involved in the Artificial Intelligence segment of the market. 

The outperformance in this sector has resulted in the ten largest stocks in the S&P 500, now representing almost 35% of the entire index capitalization. This amount of concentration in the index has not been seen since the late 1990’s. A corollary of this is that market valuations have now approached or exceeded those levels of the late 1990’s [2].

Admittedly the rage of the late 1990’s was the internet (which has proven to be a game changer in our business and personal lives) and today the thing that garners most of the buzz is Artificial Intelligence.

We at Cypress Bank & Trust are not predicting that we will have a market sell off like we had at the beginning of this century but since our investment approach is grounded in fundamentals and our team has over 100 years of combined experience managing clients’ assets, we are somewhat circumspect regarding current market levels. Rest assured that we remain vigilant in our approach and seek to not only generate quality returns for our clients but also manage the risks of our clients’ portfolios.

Equity

The S&P 500 closed 2024 up 23.3%, marking one of the best years in its history. During the year, the index reached an all-time high a remarkable 57 times, a feat that only happened four other years since 1929 [3]. The combination of interest rate cuts, artificial intelligence, and the incoming Trump administration were some of the main culprits behind this bull market. Market concentrations continued to increase to a high since at least 1996. Compared to the S&P 500’s 2024 return of 23%, the “Magnificent 7” stocks returned over 65% year to date while the Equal Weight S&P 500 Index returned 11%. The same was true for the fourth quarter of 2024, with the “Magnificent 7” returning nearly 20% versus the S&P 500 returning below 4% [4].

As we enter 2025, there are some questions that market participants are still waiting to be answered. Top of the mind is interest rates and inflation uncertainty, a new White House Administration starting on January 20th, and the ongoing geopolitical tensions in Ukraine & Russia, Israel & Iran, and that not so much talked about lately China & Taiwan. However, there are a lot of promising developments shaping up, especially in artificial intelligence and healthcare. 

Fixed Income

The 4th quarter of 2024 in the fixed income markets was marked by declining interest rates in the short end of the yield curve and substantially increasing interest rates in the long end of the yield curve. The 10-year Treasury yield closed Q4 at 4.57%, increasing 83 basis points in the past three months [5]. This measure has a close relationship to mortgage rates, and thus the reason we have seen mortgage rates increasing in the second half of 2024 even though the Federal Reserve (“The Fed”) cut interest rates by a total of 1% in this period.

For 2025, the market is pricing in a range of interest rate cuts in the magnitude of 25 to 75 basis points. However, it remains to be seen how some of the economic data will unfold through the next few months. Inflation has been stubborn in reaching the Fed’s 2% target, unemployment remains at 4.2%, and GDP numbers have been higher than most would have expected.

Outlook

The 4th quarter of 2024 in the fixed income markets was marked by declining interest rates in the short end of the yield curve and substantially increasing interest rates in the long end of the yield curve. The 10-year Treasury yield closed Q4 at 4.57%, increasing 83 basis points in the past three months. This measure has a close relationship to mortgage rates, and thus the reason we have seen mortgage rates increasing in the second half of 2024 even though the Federal Reserve (“The Fed”) cut interest rates by a total of 1% in this period.

For 2025, the market is pricing in a range of interest rate cuts in the magnitude of 25 to 75 basis points. However, it remains to be seen how some of the economic data will unfold through the next few months. Inflation has been stubborn in reaching the Fed’s 2% target, unemployment remains at 4.2%, and GDP numbers have been higher than most would have expected.

1. Investing.com, S&P 500 Year-End Gains Top 20% for Second Year Running, 01/03/2025.
2. FactSet, Standard & Poor’s, J.P. Morgan Asset Management, data as of 11/30/2024.
3. Yahoo Finance, The S&P 500 Just Did Something for Only the 5th Time Ever, 12/08/2024.
4.  FactSet, data as of 01/02/2025
5.  CNBC, data as of 01/02/2025.

Disclosures

Trust and Portfolio Management services offered by Cypress Bank & Trust are not insured by the FDIC; are not deposits, are not guaranteed; and are subject to investment risks, including possible loss. This does not constitute an offer or solicitation.

This information should not be considered investment advice. Opinions expressed reflect the judgment of the authors and are current opinions as of the date appearing in this material only. While every effort has been made to verify the information contained herein, we make no representations as to its accuracy and it should not be regarded as a complete analysis of the subjects discussed. Past performance does not predict future results. Content should not be construed as legal or tax advice. Always consult an attorney or tax professional regarding your specific legal or tax situation. All investing involves risk, including the loss of some or all of your investment.

Any indices and other financial benchmarks shown are provided for illustrative purposes only, are unmanaged, reflect reinvestment of income and dividends and do not reflect the impact of advisory fees. Investors cannot invest directly in an index. Comparisons to indexes have limitations because indexes have volatility and other material characteristics that may differ from a particular fund.

Certain information contained herein constitutes “forward-looking statements,” which can be identified by the use of forward-looking terminology such as “may,” “will,” “should,” “expect,” “anticipate,” “project,” “estimate,” “intend,” “continue,” or “believe,” or the negatives thereof or other variations thereon or comparable terminology. Due to various risks and uncertainties, actual events, results or actual performance may differ materially from those reflected or contemplated in such forward-looking statements. Nothing contained herein may be relied upon as a guarantee, promise, assurance or a representation as to the future.

Information obtained from third party sources is believed to be reliable but has not been independently verified and its accuracy or completeness cannot be guaranteed. No representation is made with respect to the accuracy, completeness, or timeliness of this document.

Specific investments described herein do not represent all investment decisions made by Cypress Bank & Trust. The reader should not assume that investment decisions identified and discussed were or will be profitable. Specific investment advice references provided herein are for illustrative purposes only and are not necessarily representative of investments that will be made in the future.

Hand holding compass, Cypress Bank publication.
The Compass Q3 2024

Is the Federal Reserve on the horns of a dilemma?

Ever since the Federal Reserve began raising interest rates in March of 2022 Wall Street pundits have been anticipating the eventual easing of interest rates by the Federal Reserve. Over the past twelve months the collective market punditry has speculated that the Federal Reserve will cut rates from zero to seven times this year. Now that the Federal Reserve has begun to cut interest rates at their last meeting in September two questions need to be asked:

1. Are additional rate cuts necessary? 
2. If so, then how many?

Many economic statistics indicate the economy is slowing down, and the Federal Reserve needs to act before more economic damage is incurred. On the other hand, there are just as many economic statistics that indicate that the economy is not in a recession and in fact has been growing, albeit slowly, consistently for the past number of quarters.
As of last quarter, U.S. household wealth rose at almost a 7% annual rate (double the pace of disposable income growth) to a record $184.5 trillion driven primarily from gains in real estate and the stock market. At the same time credit card delinquency rates have doubled off the lows from Q3 2021 and Americans owe a record $1.14 trillion (about $3,500 per person in the US) on their credit cards.

Although unemployment has risen to 4.2% from 3.5% and the number of unemployed people stands at 7.1 million so far this year, there have been almost 1.5 million jobs created. 

Inflation as measured by the Consumer Price Index has fallen from over 9% annually to 2.5% over the last 12 months. Although the Federal Reserve has a stated 2% annual goal for inflation many members have stated a desire to have additional rate cuts before year end and into 2025.

While some might argue for a significant number of rate cuts there are many who would prefer that the number of rate cuts be kept at a minimum. The impact of these potential cuts will impact not only the stock market but also the amount of interest that investors can earn along with the price of real estate and other assets in addition to the overall economy.

As the Federal Reserve wrestles with this dilemma, we at Cypress Bank & Trust are diligently evaluating the various market forces that can impact our clients’ portfolios and aiming to determine how to best position them so that we can take advantage of the potential opportunities that the markets present. There is no single investment or portfolio that is right for every investor, that is why we seek to tailor our solutions for each client’s specific needs and goals.

US yield curve graph with maturity and yield values.

Equities

The third quarter roller coaster has finally come to a halt. Although the mood of investors ended the quarter on a positive note, let’s not forget how we got here. The stock market, as measured by the S&P 500 Index, finished Q3 with a 5.6% return for the quarter and a 22% return year to date. However, in early August we witnessed the S&P 500 have its largest single day drop of 3% in nearly two years because of the Japanese Yen carry trade unwind. Some market participants were even calling for an emergency interest rate cut from the Federal Reserve, an act that we have seen happen twice in the past 20 years; during the Great Financial Crisis in 2008 and the Covid-19 pandemic in March of 2020. The markets did calm down and returned to their positive trajectory once economic data releases, like the Consumer Price Index (CPI) and the Personal Consumption Expenditures Index (PCE), showcased the inflation rate moving towards its 2% target. On their September 18th Federal Open Market Committee meeting, the Federal Reserve did begin its much-anticipated interest rate cutting cycle with a large 50 basis point cut, a move that saw the S&P 500 rally nearly 3% in these last two weeks of the quarter. Market gyrations can be overwhelming if looked at within a short time frame and that’s why here at Cypress Bank & Trust we believe in staying invested for the long term as the best chance of achieving your return goals.

Market rotation was another big theme during Q3, as some of the underperforming sectors and pockets of the market exhibited overperformance during this quarter. The equal weighted S&P 500 had nearly double the return of the market weighted index at 10.4% for Q3 as measured by the Invesco S&P 500 Equal Weight ETF (RSP). We also saw the semiconductor industry have a return of -5% for the quarter, measured by the VanEck Semiconductor ETF (SMH), against a return of over 10% for the Russell 2000 Index (Mid and Small caps). Lastly, the top three performing sectors in Q3 were Utilities, Real Estate, and Industrials returning 19.4%, 15.5%, and 11.1%, respectively, while the bottom 3 sectors were Technology, Energy, and Communication Services with returns of -1.25%, -0.95%, and 1.82%, respectively.

Graph of CPI inflation contributors by category, 2021-2024.

Fixed Income

The Treasury yield curve has been inverted (2-year yields being higher than the 10-year yields) for the longest stretch of time on record since July of 2022. An inverted yield curve has historically been a sign that a recession is looming, however; one has not yet arrived. In August of this year, the yield curve finally normalized as expectations of an interest rate cut increased after a series of good inflation data and weakening labor markets reports were released.

The Federal Reserve did indeed cut their benchmark rate by 50 basis points, to the surprise of many, to take their current target range from 4.75% to 5%. There are expectations that the Federal Reserve will continue to move on with its cutting rate cycle through the rest of 2024 and into the first few meetings of 2025.

Congruent to the Equity markets, gains in the broad Fixed Income markets continued to pile on during the third quarter. Yields on Treasury notes for all durations fell throughout the third quarter. As yields fell bonds had some price appreciation, the Bloomberg US Aggregate Index (the most used fixed income index in the US) gained 5.8% for Q3, and over the past 12 months it has gained 11.6%.

Graph of treasury yields, federal funds rate trends.

Outlook

As we look ahead to the next quarter, the market outlook reflects a mix of cautious optimism and underlying challenges. Economic indicators suggest moderate growth, driven by consumer spending and a resilient labor market. However, inflationary pressures continue to influence monetary policy, with potential for interest rate adjustments that could impact borrowing costs and consumer confidence. Investors are closely watching central bank signals, which will play a crucial role in shaping market sentiment.

Additionally, geopolitical tensions and supply chain disruptions remain significant factors that could introduce volatility. The upcoming election may also introduce uncertainty into the markets. We will stay informed and adaptable, considering both opportunities and risks as we approach this final quarter of 2024, and the calendar turns to 2025.

Always vigilant, our commitment to you is to navigate your portfolio through both calm and turbulent times to work towards your long-term goals and objectives.

Disclosures

Trust and Portfolio Management services offered by Cypress Bank & Trust are not insured by the FDIC; are not deposits, are not guaranteed; and are subject to investment risks, including possible loss. This does not constitute an offer or solicitation.

This information should not be considered investment advice. Opinions expressed reflect the judgment of the authors and are current opinions as of the date appearing in this material only. While every effort has been made to verify the information contained herein, we make no representations as to its accuracy and it should not be regarded as a complete analysis of the subjects discussed. Past performance does not predict future results. Content should not be construed as legal or tax advice. Always consult an attorney or tax professional regarding your specific legal or tax situation. All investing involves risk, including the loss of some or all of your investment.

Any indices and other financial benchmarks shown are provided for illustrative purposes only, are unmanaged, reflect reinvestment of income and dividends and do not reflect the impact of advisory fees. Investors cannot invest directly in an index. Comparisons to indexes have limitations because indexes have volatility and other material characteristics that may differ from a particular fund.

Certain information contained herein constitutes “forward-looking statements,” which can be identified by the use of forward-looking terminology such as “may,” “will,” “should,” “expect,” “anticipate,” “project,” “estimate,” “intend,” “continue,” or “believe,” or the negatives thereof or other variations thereon or comparable terminology. Due to various risks and uncertainties, actual events, results or actual performance may differ materially from those reflected or contemplated in such forward-looking statements. Nothing contained herein may be relied upon as a guarantee, promise, assurance or a representation as to the future.

Information obtained from third party sources is believed to be reliable but has not been independently verified and its accuracy or completeness cannot be guaranteed. No representation is made with respect to the accuracy, completeness, or timeliness of this document.

Specific investments described herein do not represent all investment decisions made by Cypress Bank & Trust. The reader should not assume that investment decisions identified and discussed were or will be profitable. Specific investment advice references provided herein are for illustrative purposes only and are not necessarily representative of investments that will be made in the future.

The Compass Q2 2024

“It was the best of times, it was the worst of times, it was the age of wisdom, it was the age of foolishness, it was the epoch of belief, it was the epoch of incredulity, it was the season of light, it was the season of darkness, it was the spring of hope, it was the winter of despair.”

― Charles Dickens, A Tale of Two Cities

While Dickens was contrasting the lives of three families in London and Paris during the French Revolution, we think he could easily have been describing the stock market in 2024. For investors who owned a small select group of stocks (specifically Nvidia, Taiwan Semiconductor, Eli Lilly, Broadcom & Qualcomm) your return so far in 2024 is in excess of 70%. If on the other hand you owned the Dow Jones Industrial Average your return year to date is 5%, which pales in comparison.

For the year, the S&P 500 is up 15% and it is commonly known that Nvidia, Microsoft, Meta, Alphabet, Amazon, and Apple account for over 60% of the S&P 500’s year to date gain. What is less well known is that the average stock is priced about where it was at the start of 2022. 

As a result of their epic move, Nvidia, Microsoft and Apple now account for over 20% of the entire S&P 500 market capitalization. Historically this type of market concentration has proven to be an inflection point in the market. Only time will tell if this time will be different or not but we at Cypress Bank & Trust are not sitting on our hands. We expend a significant amount of time and energy not only researching the positions to add to our clients’ portfolios but also quite a bit of time evaluating the existing holdings in our clients’ portfolios.

In this way we can properly weigh potential risks and return opportunities that the markets, asset classes and specific securities offer our clients. The outcome is a customized portfolio that is bespoke for each client so we aim to achieve the specific goals and characteristics tailored to each client.

As such we are better able to position our clients’ portfolios over a wide ranging variety of market outcomes because our experience has taught us that no matter how optimistic or pessimistic the market is about future events just as we saw in A Tale of Two Cities, things are not always what they seem and it is our commitment to our clients to endeavor to discern the difference.

Equities

The U.S. stock market has continued its upward trajectory during the second quarter. The S&P 500 index closed the quarter at an all-time high for the second quarter in a row. The S&P 500 was up 4% in the second quarter, taking the year-to-date return to over 15%. The Nasdaq Composite, which has a high exposure to Technology, had a return of 8% for the quarter while the Dow Jones Industrial Average retreated nearly 2%.

In Q1 of 2024, the S&P 500 saw their earnings grow 5.9% year over year. Identical to the Q4 of 2023, the sectors with double digit growth in Q1 of 2024 were Communication Services, Consumer Discretionary, Utilities, and Technology. However, Materials, Healthcare, and Energy sectors saw negative earnings growth. The variance between the top and bottom performing sector was 59%. As for revenues, the spread was much narrower at 16%. Of the 11 sectors, 8 saw positive revenue growth ranging from 3% to 8%.

In this first half of 2024, we have seen the concentration further increase in the S&P 500. The Magnificent 7 (composed of Apple, Microsoft, Alphabet, Amazon, Nvidia, Meta Platforms, and Tesla) had a 33% return year to date, while the S&P 500 ex-Magnificent 7 had returns of a mere 5%. The Invesco S&P 500 Equal Weight ETF (Exchange Traded Funds) also returned 5% for the first half, while retreating 3% in the most recent Q2.

There is optimism the Federal Reserve will finally start cutting interest rates this year as early as September. To offset this optimism, geopolitical tensions are still high along with the looming presidential elections in the US and globally, in which many market impacting issues are up for debate. 

Fixed Income

Treasury yields displayed heightened volatility in the beginning of the second quarter, as inflation figures for the beginning of the year were hotter than expected. The Federal Reserve (the Fed) held two meetings in this past quarter where it decided to hold interest rates steady. However, during their May meeting, the Fed announced a decrease in the speed of its balance sheet runoff by shrinking the current cap of $60 billion to $25 billion per month of US Treasury securities it lets mature and not be replaced. The Fed’s balance sheet runoff is often referred to as quantitative tightening (QT), and as the name implies it is meant to decrease excessive liquidity in the economy. The change in the runoff cap by the Fed is aimed at decreasing the pace of QT and keeping longer term interest rates more stable as the Fed only has control over short-term rates. In their June meeting, the Federal Reserve released the “dot plots” (the expected path for rates) where it targeted one cut by the end of 2024, a shift from their previous expectations of three cuts.

The unemployment rate increased during the second quarter, although it has only done so incrementally from 3.9% to 4% in the last reading. In terms of inflation, we have seen it come down drastically from 2022 where it was as high as 9%, but it has been stuck around 3% since the summer of 2023. The interest rate path forward will depend on several factors, the two most important being inflation and employment levels.

Outlook

Predictions of a recession have come in waves through the last 3 years, and yet here we still stand. While the scare of a recession is still afloat, it has reasonably retreated in these past six months. On one side of the coin, inflation figures have substantially improved, unemployment remains below the historical average, and the stock market is continually topping its all-time highs. The other side of the coin is a bit grimmer as geopolitical risk remains high, inflation is proving to be sticky at around 3% which is above the Fed’s 2% target, and the stock market is breaking records in concentration risk and high valuations multiples. At last, we still have an election in November which has implications in taxes, government spending, and global trade. So, where does our economy go from here? Here at Cypress Bank & Trust, we maintain investors should stay focused on the long-term and maintain adequate diversification to help them navigate these uncertainties.

Always vigilant, our commitment to you is to navigate your portfolio through both calm and turbulent times to work towards your long-term goals and objectives.

We hope you and your family have a healthy and fulfilling summer!!!

Disclosures

Trust and Portfolio Management services offered by Cypress Bank & Trust are not insured by the FDIC; are not deposits, are not guaranteed; and are subject to investment risks, including possible loss. This does not constitute an offer or solicitation.

This information should not be considered investment advice. Opinions expressed reflect the judgment of the authors and are current opinions as of the date appearing in this material only. While every effort has been made to verify the information contained herein, we make no representations as to its accuracy and it should not be regarded as a complete analysis of the subjects discussed. Past performance does not predict future results. Content should not be construed as legal or tax advice. Always consult an attorney or tax professional regarding your specific legal or tax situation. All investing involves risk, including the loss of some or all of your investment.

Any indices and other financial benchmarks shown are provided for illustrative purposes only, are unmanaged, reflect reinvestment of income and dividends and do not reflect the impact of advisory fees. Investors cannot invest directly in an index. Comparisons to indexes have limitations because indexes have volatility and other material characteristics that may differ from a particular fund.

Certain information contained herein constitutes “forward-looking statements,” which can be identified by the use of forward-looking terminology such as “may,” “will,” “should,” “expect,” “anticipate,” “project,” “estimate,” “intend,” “continue,” or “believe,” or the negatives thereof or other variations thereon or comparable terminology. Due to various risks and uncertainties, actual events, results or actual performance may differ materially from those reflected or contemplated in such forward-looking statements. Nothing contained herein may be relied upon as a guarantee, promise, assurance or a representation as to the future.

Information obtained from third party sources is believed to be reliable but has not been independently verified and its accuracy or completeness cannot be guaranteed. No representation is made with respect to the accuracy, completeness, or timeliness of this document.

Specific investments described herein do not represent all investment decisions made by Cypress Bank & Trust. The reader should not assume that investment decisions identified and discussed were or will be profitable. Specific investment advice references provided herein are for illustrative purposes only and are not necessarily representative of investments that will be made in the future.


Compass in hand, April 2024 publication cover.
The Compass Q1 2024

“I skate to where the puck is going to be, not where it has been.”
-Wayne Gretzky aka “the Great One”
Nine-time winner of the Hart Trophy (NHL Most Valuable Player)

INVESTMENT UPDATE

This year’s market advance (saying nothing of the advance since the end of October 2023) has been breathtaking to say the least. While 2023 was dominated by the Magnificent Seven (Apple, Amazon, Alphabet, Meta, Microsoft, Nvidia, and Tesla) so far in 2024 the market has broadened out to include many other stocks and sectors. In fact, the two leading sectors so far in 2024 are Energy and Communication Services.

For the 1st quarter of 2024 the S&P 500 was up 10%, which would be annualized out to almost 50% if the market continues at this pace. Although S&P 500 earnings are expected to grow by approximately 10% in 2024 there have not been any significant upward revisions to these estimates since the end of the 3rd quarter of 2023 along with the fact that the 10-year Treasury Note yield has increased from 3.90% at the end of 2023 to 4.20% currently. The significance of these points is that almost the entire move in the equity market can be explained by the multiple expansion of the Price to Earnings ratio.

Said a different way, investors are paying more today for a $1 worth of future earnings than they were 5 months ago.
So, what are investors to do? While the easy approach would be to continue to invest in the “hot” sectors of the market, we at Cypress Capital Group subscribe to a more rigid investment process than just chasing the most recent fad. Like how Wayne Gretzky approached hockey, we believe in using our quantitative investment approach where we can identify tomorrow’s opportunities today. In this way, we strive to minimize the risk of getting caught up in the emotional throes of the market and make sound investment choices for our clients’ portfolios. Admittedly, this approach requires a certain degree of patience, which is often said to be the rarest commodity on Wall Street, but our experience has taught us that in order to responsibly manage and grow wealth an investor needs to be patient.

THE MARKET UPDATE

Equities

The equity markets started off at a positive pace to begin the year. The S&P 500 ended the quarter at an all-time high along with posting the best first quarter in some 5 years. The S&P 500 was up just over 10% for the quarter, while the Dow Jones Industrial Average and Nasdaq also participated, up 5.6% and 9.1%, respectively. Much like 2023 ended, the market’s gains were pushed by the excitement around artificial intelligence (“AI”) and the demand for stocks that had exposure to that industry. While those stocks associated with AI led the markets early on, there was some broadening out towards the end of the quarter. The Invesco S&P 500 Equal Weighted index participated also, outpacing the major indices for the month and up greater than 7% in the quarter.

As for earnings, the S&P 500 delivered 10.1% growth in 4Q23. This was driven by double digit growth by Communication Services, Consumer Discretionary, Utilities, and Technology. These growth numbers were dragged down by Health Care, Materials, and Energy. There was a significant spread between the top and bottom section of some 74%. Each reported negative earnings for the quarter. Revenues by comparison were up 3.7% for the most recent quarter. These numbers did not have the variance that

earnings had. There was only an 18% variance. Of the 11 major sectors, only 3 had negative results: Materials, Utilities, and Energy. The remaining sectors are reported at between 2.9% (Consumer Staples) and 7.9% (Technology). Source: LSEG S&P 500 Earnings Scorecard as of 3/28/24

Where do we go from here… The markets have all been positive not only since the beginning of the year, but also looking back to the lows posted in October. Prices have moved higher and while some stocks have gotten cheaper on a valuation basis, the major indices have not. Going forward, what are investors going to do? Will they continue to stay invested in those names that have outperformed, and do they continue to deliver based on expectations? Or is there broadening of the market participation that is sustainable? For either decision, what are investors willing to pay based upon interest rates and their direction? These seem like the same questions we have been asking for the last year plus. Will we get any answers or continue to climb those walls of worry?

Fixed Income

The fixed income markets continue to be volatile, but at the intermediate to long end of the curve. While the Fed has hinted at lowering rates, the evidence of when and how much continues to be the major discussion. Late in 2023 the Fed issued their “dot plots” (the expected path for rates) and targeted some 3 cuts in 2024. There was a major disagreement as the market had forecasted 6 – 7 cuts. Three months into 2024, both seem to have been way off. The Fed has an expectation of 0-2 cuts now, while the markets are betting on 1-3 cuts. This uncertainty has added to confusion and volatility in all markets. Numbers across the economy have been mixed while inflation remains sticky around the 3% level and job growth remains persistent (unemployment rate remains below 4%). The short end of the curve will not begin to move until the Fed starts to cut but the benchmark 10-year US Treasury continues to move based on those expectations for future cuts and more importantly the reasons for the cuts or the impact on the economy. The 10-year US Treasury closed the quarter with a 4.26% yield. In the last couple of days, it has even pushed slightly higher, putting it at levels we have not seen since late 2023. Where we go from here will be based on both the Federal Reserve and the economy, and their impact on each other.

OUTLOOK

If the year ended now most investors would be happy with a double-digit return, and to get that in only 3 months is even more impressive. That is on top of the gains investors got in 2023. But most investors, while concerned with the short run, own equities for longer-term appreciation. That is what has investors on uneasy ground. The yield curve has given investors an alternative to stocks with Treasuries maturing within the next 12 months still yielding over 5% with much less inherent risk. Going forward, we all ask the same question – is the risk worth the reward? This is also a question the Federal Reserve seems to be asking. Not what is the Fed’s next move in interest rates, but when will their first cut take place? One of the questions we continue to ask is – what will be the Fed’s rationale for the looming rate cut? With a stronger than expected economy and an inflation rate that appears to be sticky around the 3% level, currently we are having a tough time producing a reason for the first and subsequent rate cuts. Earnings and expectations around those reports will help drive investor sentiment going forward.

Trust and Portfolio Management services offered by Cypress Bank & Trust are not insured by the FDIC; are not deposits, are not guaranteed; and are subject to investment risks, including possible loss. This does not constitute an offer or solicitation.

This information should not be considered investment advice. Opinions expressed reflect the judgment of the authors and are current opinions as of the date appearing in this material only. While every effort has been made to verify the information contained herein, we make no representations as to its accuracy and it should not be regarded as a complete analysis of the subjects discussed. Past performance does not predict future results. Content should not be construed as legal or tax advice. Always consult an attorney or tax professional regarding your specific legal or tax situation. All investing involves risk, including the loss of some or all of your investment.

Any indices and other financial benchmarks shown are provided for illustrative purposes only, are unmanaged, reflect reinvestment of income and dividends and do not reflect the impact of advisory fees. Investors cannot invest directly in an index. Comparisons to indexes have limitations because indexes have volatility and other material characteristics that may differ from a particular fund.

Certain information contained herein constitutes “forward-looking statements,” which can be identified by the use of forward-looking terminology such as “may,” “will,” “should,” “expect,” “anticipate,” “project,” “estimate,” “intend,” “continue,” or “believe,” or the negatives thereof or other variations thereon or comparable terminology. Due to various risks and uncertainties, actual events, results or actual performance may differ materially from those reflected or contemplated in such forward-looking statements. Nothing contained herein may be relied upon as a guarantee, promise, assurance or a representation as to the future.

Information obtained from third party sources is believed to be reliable but has not been independently verified and its accuracy or completeness cannot be guaranteed. No representation is made with respect to the accuracy, completeness, or timeliness of this document.

Specific investments described herein do not represent all investment decisions made by Cypress Bank & Trust. The reader should not assume that investment decisions identified and discussed were or will be profitable. Specific investment advice references provided herein are for illustrative purposes only and are not necessarily representative of investments that will be made in the future.

Fixed Income – The Compass – January 2024

FIXED INCOME

The fixed income markets continue to be volatile, but at the intermediate to long end of the curve. While the Fed has hinted at lowering rates, the evidence of when and how much continues to be the major discussion. Late in 2023 the Fed issued their “dot plots” (the expected path for rates) and targeted some 3 cuts in 2024. There was a major disagreement as the market had forecasted 6 – 7 cuts. Three months into 2024, both seem to have been way off. The Fed has an expectation of 0-2 cuts now, while the markets are betting on 1-3 cuts. This uncertainty has added to confusion and volatility in all markets. Numbers across the economy have been mixed while inflation remains sticky around the 3% level and job growth remains persistent (unemployment rate remains below 4%). The short end of the curve will not begin to move until the Fed starts to cut but the benchmark 10-year US Treasury continues to move based on those expectations for future cuts and more importantly the reasons for the cuts or the impact on the economy. The 10-year US Treasury closed the quarter with a 4.26% yield. In the last couple of days, it has even pushed slightly higher, putting it at levels we have not seen since late 2023. Where we go from here will be based on both the Federal Reserve and the economy, and their impact on each other.

Equities – The Compass – January 2024

EQUITIES

The equity markets started off at a positive pace to begin the year. The S&P 500 ended the quarter at an all-time high along with posting the best first quarter in some 5 years. The S&P 500 was up just over 10% for the quarter, while the Dow Jones Industrial Average and Nasdaq also participated, up 5.6% and 9.1%, respectively. Much like 2023 ended, the market’s gains were pushed by the excitement around artificial intelligence (“AI”) and the demand for stocks that had exposure to that industry. While those stocks associated with AI led the markets early on, there was some broadening out towards the end of the quarter. The Invesco S&P 500 Equal Weighted index participated also, outpacing the major indices for the month and up greater than 7% in the quarter.

As for earnings, the S&P 500 delivered 10.1% growth in 4Q23. This was driven by double digit growth by Communication Services, Consumer Discretionary, Utilities, and Technology. These growth numbers were dragged down by Health Care, Materials, and Energy. There was a significant spread between the top and bottom section of some 74%. Each reported negative earnings for the quarter. Revenues by comparison were up 3.7% for the most recent quarter. These numbers did not have the variance that

earnings had. There was only an 18% variance. Of the 11 major sectors, only 3 had negative results: Materials, Utilities, and Energy. The remaining sectors are reported at between 2.9% (Consumer Staples) and 7.9% (Technology). Source: LSEG S&P 500 Earnings Scorecard as of 3/28/24

Where do we go from here… The markets have all been positive not only since the beginning of the year, but also looking back to the lows posted in October. Prices have moved higher and while some stocks have gotten cheaper on a valuation basis, the major indices have not. Going forward, what are investors going to do? Will they continue to stay invested in those names that have outperformed, and do they continue to deliver based on expectations? Or is there broadening of the market participation that is sustainable? For either decision, what are investors willing to pay based upon interest rates and their direction? These seem like the same questions we have been asking for the last year plus. Will we get any answers or continue to climb those walls of worry?

Newsletter

Stay connected and discover how Cypress Bank & Trust can be your partner in achieving your financial goals.

KEEP IN TOUCH

Sign Up
Scroll to Top

New Vero Beach
Office Hours

Effective Monday, May 11, 2026, the Cypress Bank & Trust Vero Beach office located at 4625 N. A1A, Suite 2, Vero Beach, Florida 32963 will operate under the hours outlined below.

Hours of Operation
Monday through Friday, 9:00 a.m. to 5:00 p.m.

Bank Hours – Lobby
Monday through Friday, 1:00 p.m. to 5:00 p.m.